
Osmosis in plant tissue: the practicalSpec D2.3.4
In short
Plant tissue gains mass and length in hypotonic solutions because water enters its cells by osmosis, and loses mass and length in hypertonic solutions because water leaves. Plotting percentage change against solute concentration lets you deduce the isotonic concentration where the line crosses zero. Standard deviation and standard error show how reliable repeat measurements are.
When plant tissue is bathed in a hypotonic solution, water enters the cells by osmosis, so the tissue gains mass and gets longer and becomes firm. In a hypertonic solution water leaves, so the tissue loses mass and gets shorter and becomes soft.
- Cut equal-sized cylinders of tissue (for example potato) with a cork borer and trim them to the same length.
- Blot each cylinder dry, then measure its length and mass.
- Place cylinders in a range of solute concentrations, for example sucrose solutions from 0.0 to 1.0 mol dm⁻³, with several repeats at each concentration.
- Leave for the same time at the same temperature, then blot dry and measure length and mass again.
- Calculate the percentage change in mass and length for each cylinder, and the mean for each concentration.
Percentage change in mass
A potato cylinder has a mass of 2.50 g before and 2.20 g after 40 minutes in 0.6 mol dm⁻³ sucrose solution. Calculate the percentage change in mass.
- Change in mass = 2.20 − 2.50 = −0.30 g.
- Percentage change = −0.30 ÷ 2.50 × 100 = −12%.
Answer: −12% (a loss in mass, so the solution was hypertonic to the potato cells).
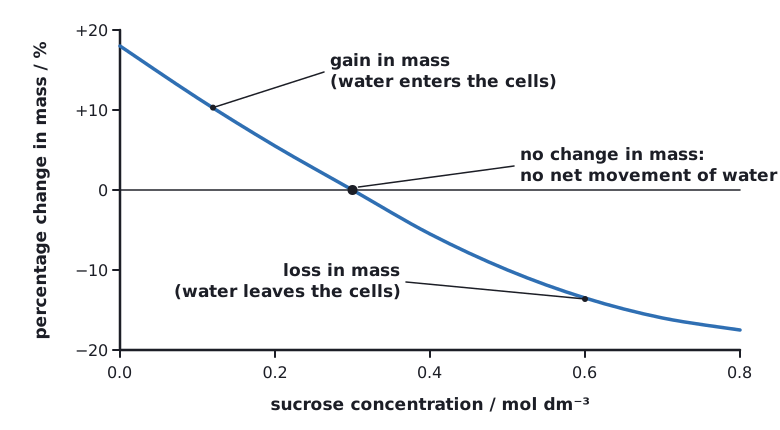 (opens full size in a new tab)
Percentage change is used because cylinders start with slightly different masses and lengths. The isotonic solute concentration of the tissue is deduced by reading where the line of best fit crosses zero percentage change.
With repeats at each concentration, calculate the standard deviation (spread of the repeats) and standard error (how precisely the mean is known) with a calculator or spreadsheet. Show standard error as error bars; you do not need to memorise the formulae.
Comparing standard errors lets you judge whether length or mass measurements were more reliable. If error bars of two means overlap widely, the difference between them may not be significant.
Written and checked against the IB Biology SL specification · Updated October 2026