
Predator–prey relationships and control of populationsSpec C4.1.16, C4.1.17
In short
Predator–prey relationships are an example of density-dependent control of animal populations. When prey are abundant, predators thrive and increase; heavier predation then reduces prey, so predators decline and prey recover. Populations can be controlled top-down, by predators at higher trophic levels, or bottom-up, by the supply of resources such as nutrients, but one usually dominates.
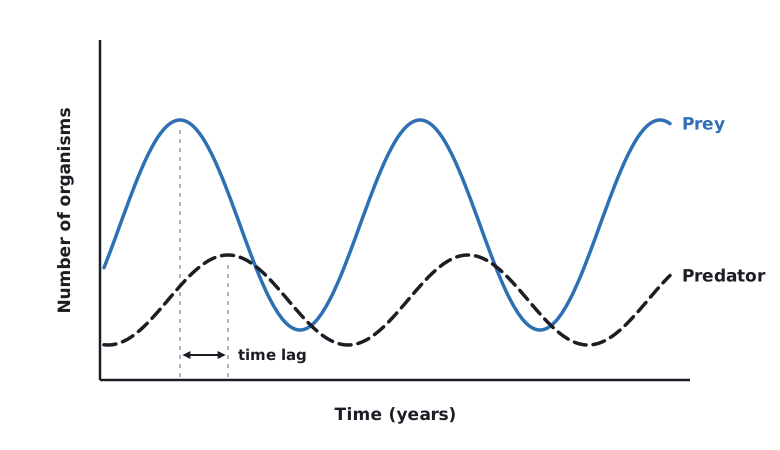
Predation is a density-dependent factor: the denser the prey, the more successful the predators. The result is often linked cycles in predator and prey numbers, with predator peaks lagging behind prey peaks.
- Prey numbers increase when food is plentiful and predators are few.
- With more food, more predators survive and breed, so predator numbers rise after a delay.
- Heavier predation (and food shortage) reduces the prey population.
- Predators now starve or breed less, so their numbers fall.
- Predation pressure eases and the prey population recovers; the cycle repeats.
 (opens full size in a new tab)
Case study: fur-trapping records kept by the Hudson's Bay Company in Canada for about a century show the numbers of Canada lynx and snowshoe hares rising and falling in cycles of roughly 10 years, with lynx peaks a year or two after hare peaks. Field experiments show hare numbers are controlled by both predation and their winter food supply.
Top-down and bottom-up control
| Top-down control | Bottom-up control | |
|---|---|---|
| Meaning | Populations are limited by consumers at the trophic level above (predators or herbivores) | Populations are limited by the supply of resources from the level below (nutrients, producers) |
| Example | Sea otters eat sea urchins; where otters were hunted out, urchins multiplied and grazed away kelp forests | Phytoplankton in the open ocean are limited by nitrate, phosphate or iron; more nutrients (as in upwelling zones) support more zooplankton and fish |
Both types of control are possible in any community, but one or the other is likely to be dominant.
Written and checked against the IB Biology SL specification · Updated October 2026