
Depolarization, repolarization and oscilloscope tracesSpec C2.2.8, C2.2.9, C2.2.10
In short
An action potential starts when the membrane reaches the threshold potential, about −55 mV, and voltage-gated sodium channels open. Na⁺ diffuses in (depolarization), then voltage-gated potassium channels open and K⁺ diffuses out (repolarization). Local currents of Na⁺ bring the next region to threshold. An oscilloscope trace plots these changes in membrane potential against time.
Depolarization and repolarization
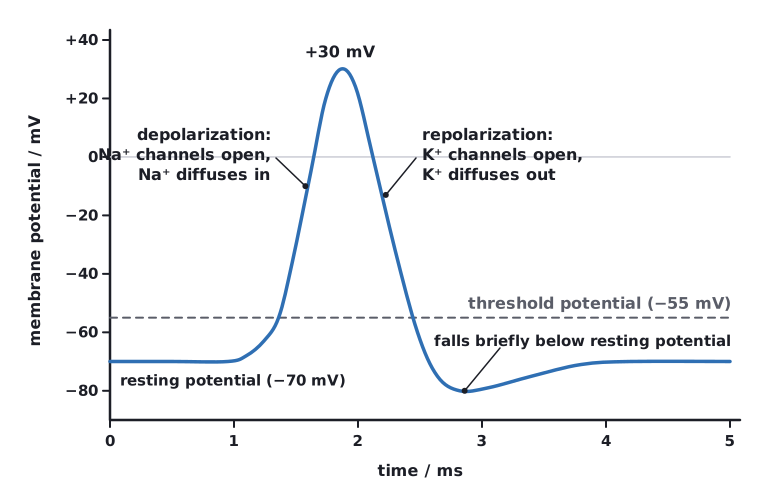
- A stimulus or local current makes the membrane potential less negative. If it reaches the threshold potential (about −55 mV), voltage-gated sodium channels open. Below threshold they stay closed and no action potential occurs.
- Na⁺ diffuses in down its concentration gradient. The entry of Na⁺ depolarizes the membrane further, opening more sodium channels, until the inside reaches about +30 mV (depolarization).
- The sodium channels close, and voltage-gated potassium channels open.
- K⁺ diffuses out, making the inside negative again (repolarization). The potential briefly falls below the resting potential before the potassium channels close.
- Sodium–potassium pumps maintain the concentration gradients, so the neuron can carry further impulses.
Propagation by local currents
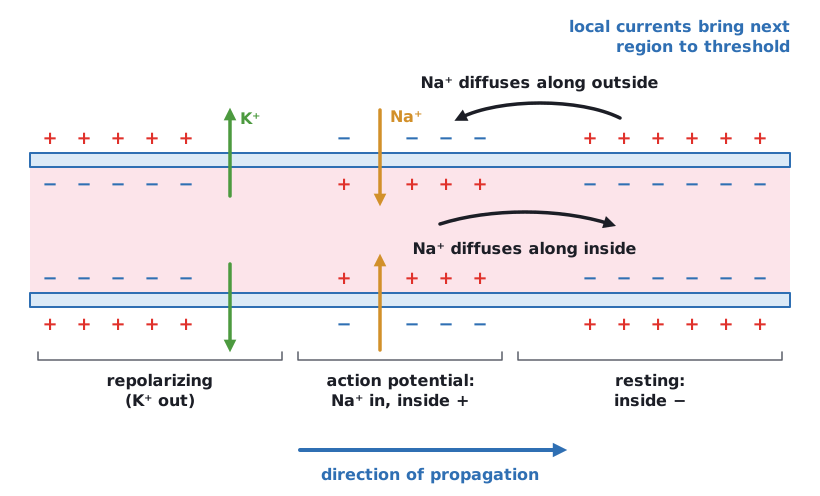
Na⁺ entering a depolarized region diffuses along the inside of the axon towards the next, still polarized region. Outside the membrane, Na⁺ diffuses from the next region towards the depolarized region. These local currents make the potential in the next region less negative until the threshold potential is reached and its sodium channels open.
The region just behind the action potential is still repolarizing and its sodium channels cannot reopen yet, so the impulse travels in one direction only.
 (opens full size in a new tab)
Oscilloscope traces
An oscilloscope trace plots membrane potential (mV) on the y-axis against time (ms) on the x-axis. You should link each part of the trace to events in the membrane.
| Part of trace | Membrane potential | Cellular event |
|---|---|---|
| Flat line before the spike | About −70 mV | Resting potential maintained by pumps and K⁺ leak |
| Small rise to threshold | −70 to −55 mV | Local currents or stimulus depolarize the membrane |
| Steep rise | −55 to about +30 mV | Voltage-gated Na⁺ channels open; Na⁺ diffuses in |
| Steep fall | +30 mV to below −70 mV | Na⁺ channels close; voltage-gated K⁺ channels open; K⁺ diffuses out |
| Return to resting level | Back to about −70 mV | K⁺ channels close; resting potential restored |
 (opens full size in a new tab)
 (opens full size in a new tab)
Number of impulses per second
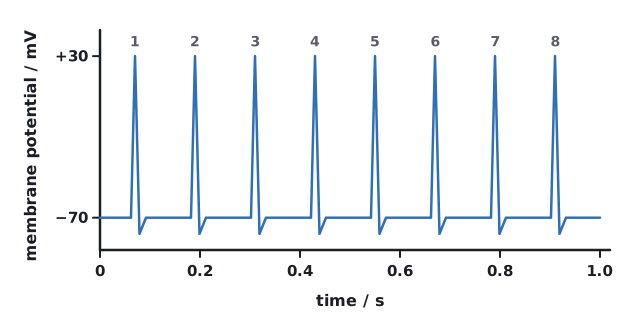
An oscilloscope trace shows 18 action potentials in a 0.30 s recording. Calculate the frequency of impulses.
- frequency = number of impulses ÷ time
- = 18 ÷ 0.30 s
Answer: 60 impulses per second (60 Hz)
Read the time scale before counting spikes. A stronger stimulus gives more impulses per second, not taller action potentials: each action potential reaches the same peak.
Written and checked against the IB Biology HL specification · Updated October 2026