
Abiotic variables and range of toleranceSpec B4.1.3, B4.1.4
In short
A range of tolerance is the span of values of an abiotic factor within which a species can survive. Abiotic variables such as temperature, light, soil pH, salinity and oxygen act as limiting factors: outside the range of tolerance a species cannot survive, so the distribution of plants and animals follows these variables, which transects can measure.
The distribution of a species depends on abiotic variables. Each species has adaptations that suit it to a certain set of conditions, and these give it a range of tolerance for each variable.
| Organisms | Abiotic variables |
|---|---|
| Plants | Light intensity, temperature, water availability, soil pH, mineral nutrients in the soil, salinity, wind exposure |
| Animals | Temperature, water availability, dissolved oxygen (aquatic animals), salinity, pH of water, shelter and substrate type |
Range of tolerance of a limiting factor
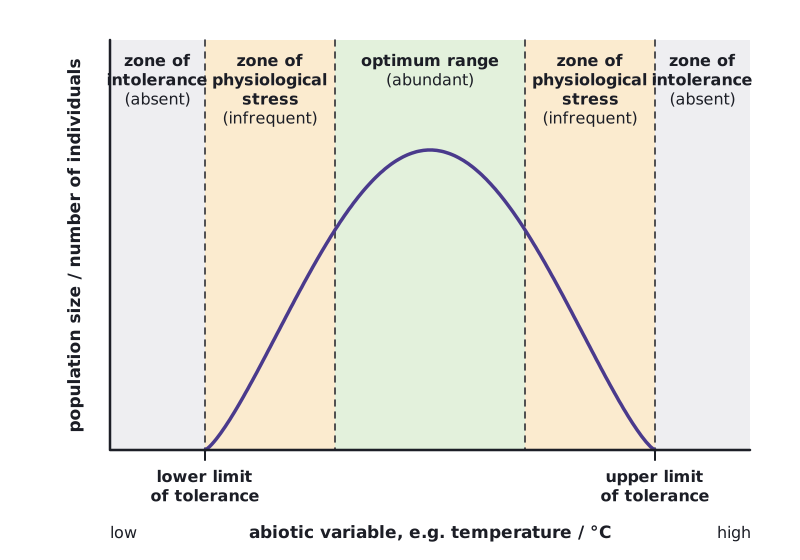
Plotting how well a species does (for example population density) against an abiotic variable gives a bell-shaped tolerance curve.
- Optimum range: conditions where the species grows and reproduces best, so it is most abundant.
- Zones of physiological stress on either side: individuals survive but grow and reproduce less, so they are fewer.
- Zones of intolerance at the extremes: the species cannot survive, so it is absent.
A limiting factor is the variable that restricts the distribution or abundance of a species because it lies closest to, or beyond, the limits of tolerance. For example, a plant may be absent from a shaded woodland floor because light intensity is below its tolerance, even though soil and water are suitable.
 (opens full size in a new tab)
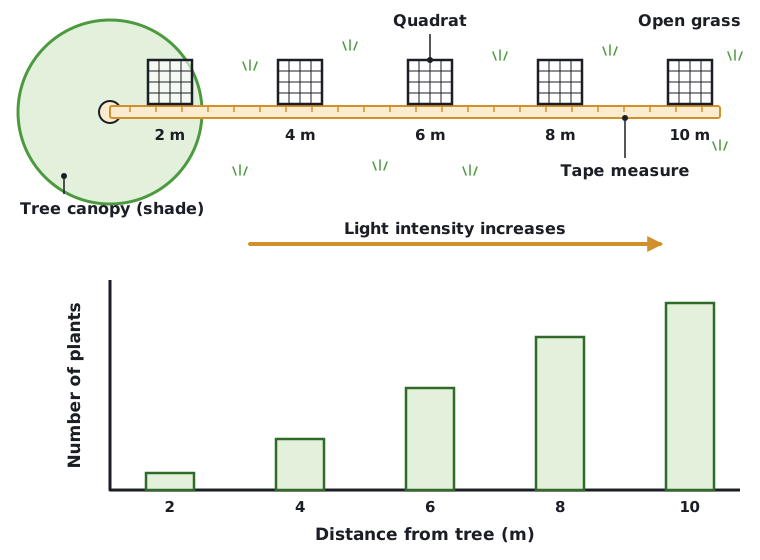
Use a line or belt transect from a natural or semi-natural habitat (influenced by humans but dominated by wild, not cultivated, species). Place quadrats at regular intervals, record abundance (percentage cover or counts) and measure the abiotic variable at each quadrat with sensors such as a light meter, temperature probe or soil pH probe.
 (opens full size in a new tab)
Mean percentage cover along a transect
At 6 m along a transect, three replicate quadrats gave 40%, 35% and 30% cover of a grass species. Light intensity there was 5200 lux. At 2 m, the mean cover was 10% and light intensity was 1100 lux. Calculate the mean cover at 6 m and describe the relationship.
- Mean = (40 + 35 + 30) ÷ 3
- = 105 ÷ 3 = 35%
- Higher light intensity (5200 lux) goes with higher cover (35%) than lower light intensity (1100 lux, 10%).
Answer: Mean cover is 35%. Cover is positively correlated with light intensity (practice data).
A scatter graph of abundance against the abiotic variable shows correlation; a correlation coefficient (for example Spearman's rank) measures its strength. Correlation does not prove the variable causes the distribution.
Written and checked against the IB Biology HL specification · Updated October 2026